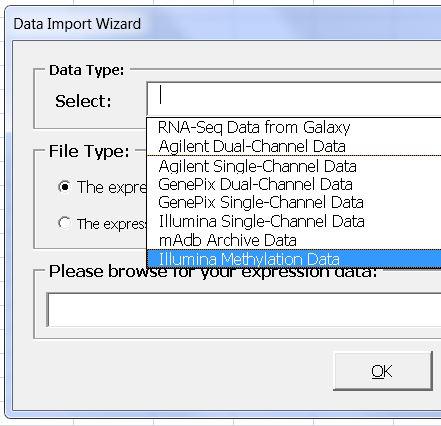
Expression Data
- Supported Data Types
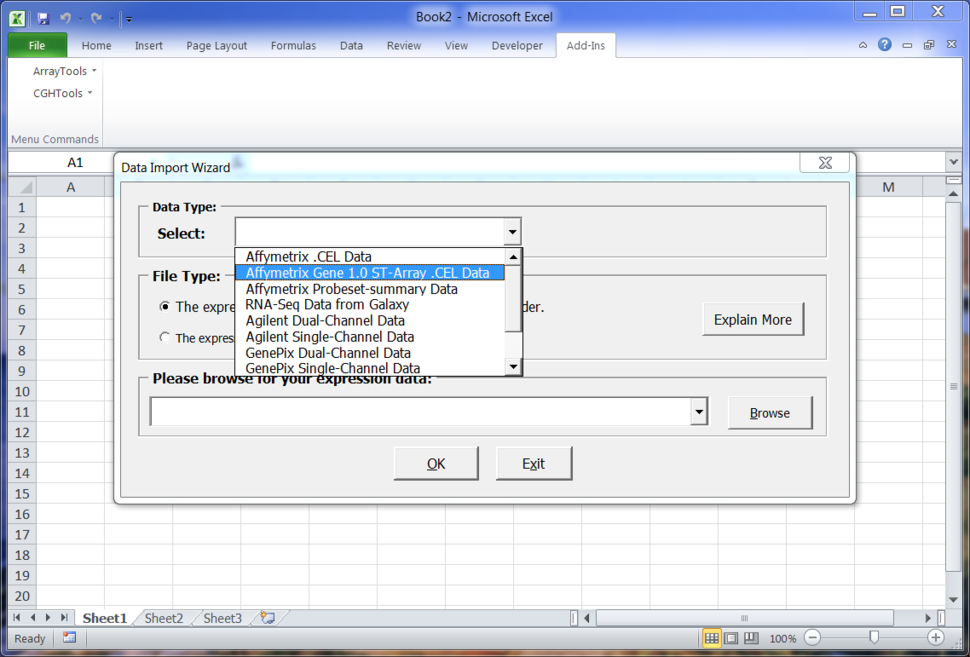
- Affymetrix 3'-IVT arrays
- Affymetrix genechip ST 1.0 arrays
- Agilent single and dual channel arrays
- Illumina expression arrays
- GenePix data
- mAdb archive data
- GDS datasets from NCBI/GEO
- Other data types through general importer
- RNA-Seq count data processed through Galaxy web tools
- Class comparison for differential expression
- Univariate tests with the option of random variance model
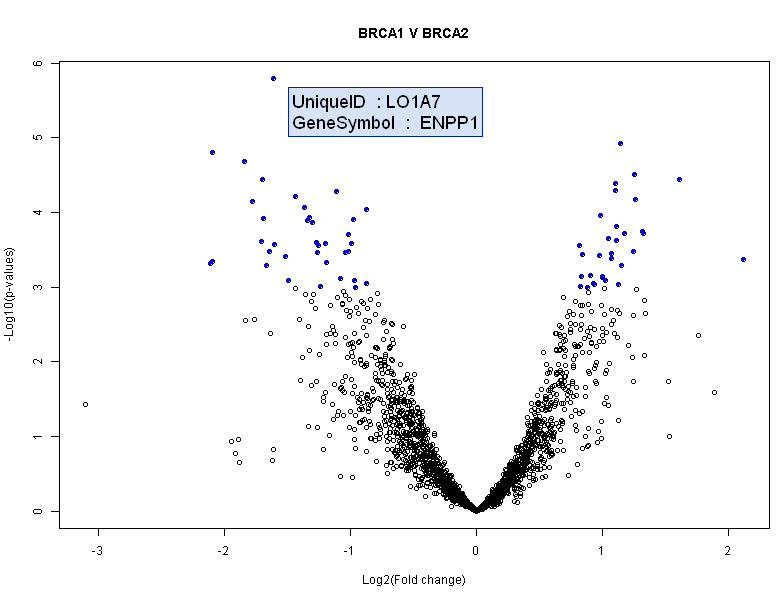
- Multivariate permutation tests
- Significance Analysis of Microarrays (SAM)
- Lassoed Principal Components
- Class prediction
- Compound covariate predictor; SVM; Bayesian compound covariate; KNN; DLDA;
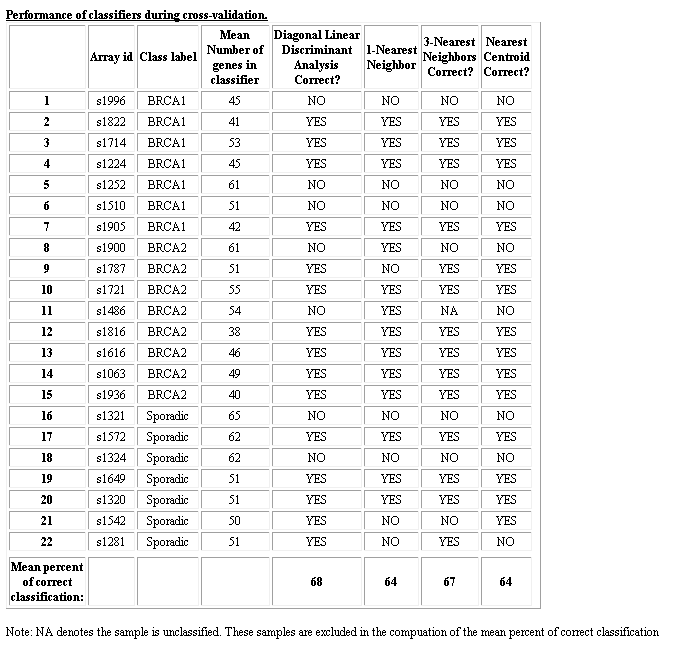
- Nearest centroid
- Adaboost
- PAM
- Lasso logistic regression
- Binary tree prediction
- Clustering
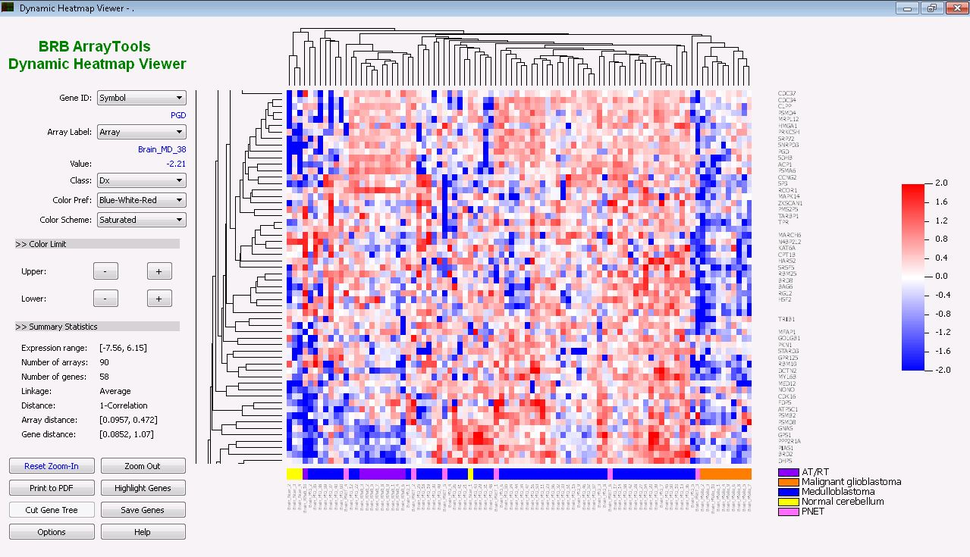
- Interactive heatmap viewer, Hierarchical clustering, Non-negative matrix factorization clustering
- 2-D and 3-D interactive Scatter-plot
- Phenotype average
- Array vs. Array
- Gene Set Enrichment Analysis with many gene sets
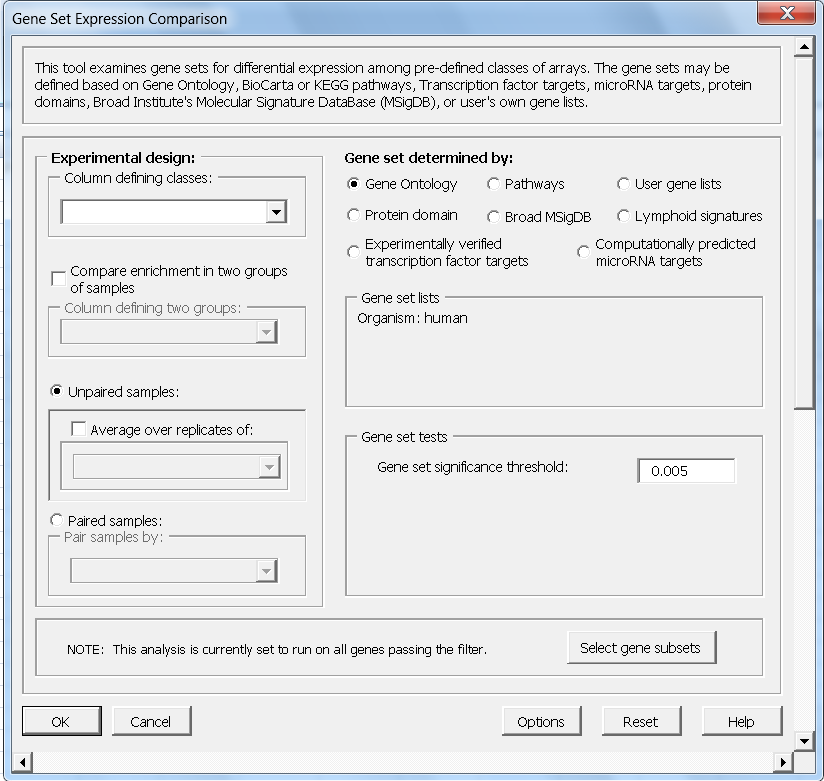
- BioCarta, KEGG, CGAP, Broad Institute - MSigDB, Gene Ontology, Protein domain, Transcription factor targets, MicroRNA targets, User defined gene lists
- Visualization of Samples
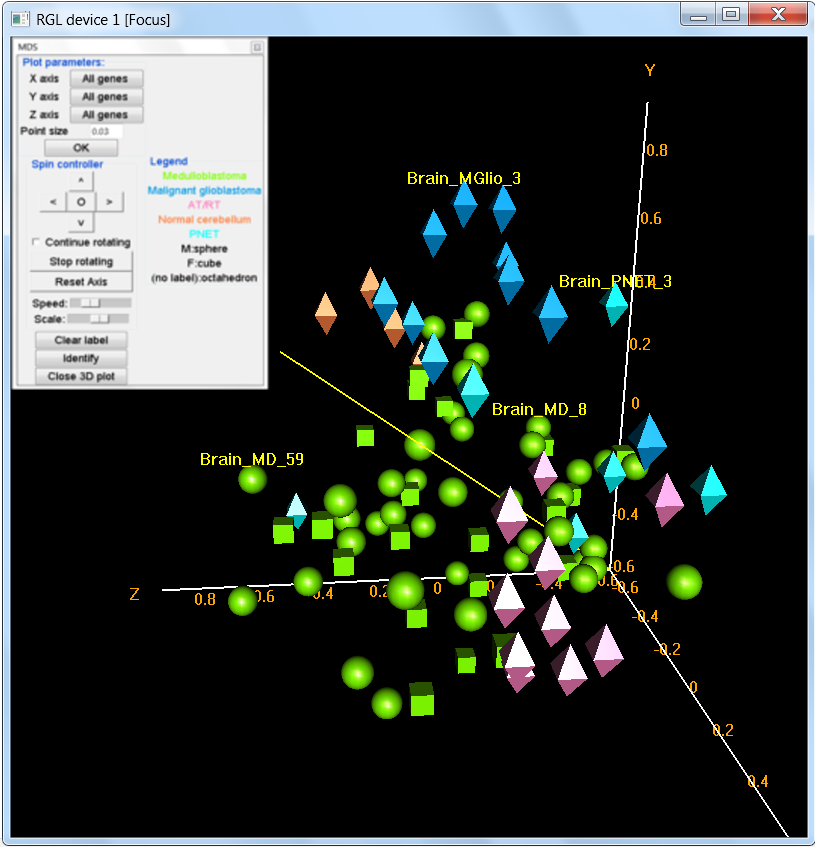
- 3-D interactive plot
- Survival Analysis
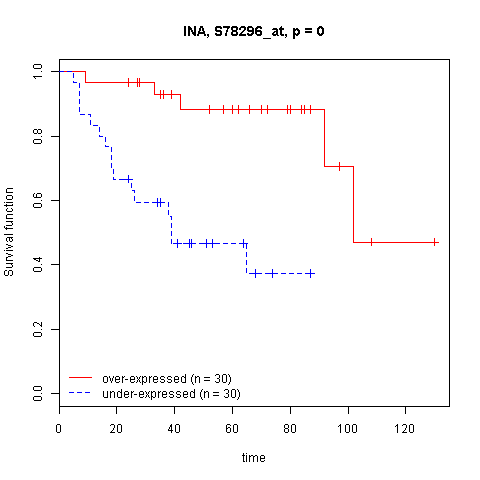
- Survival gene sets analysis
- Survival risk prediction analysis
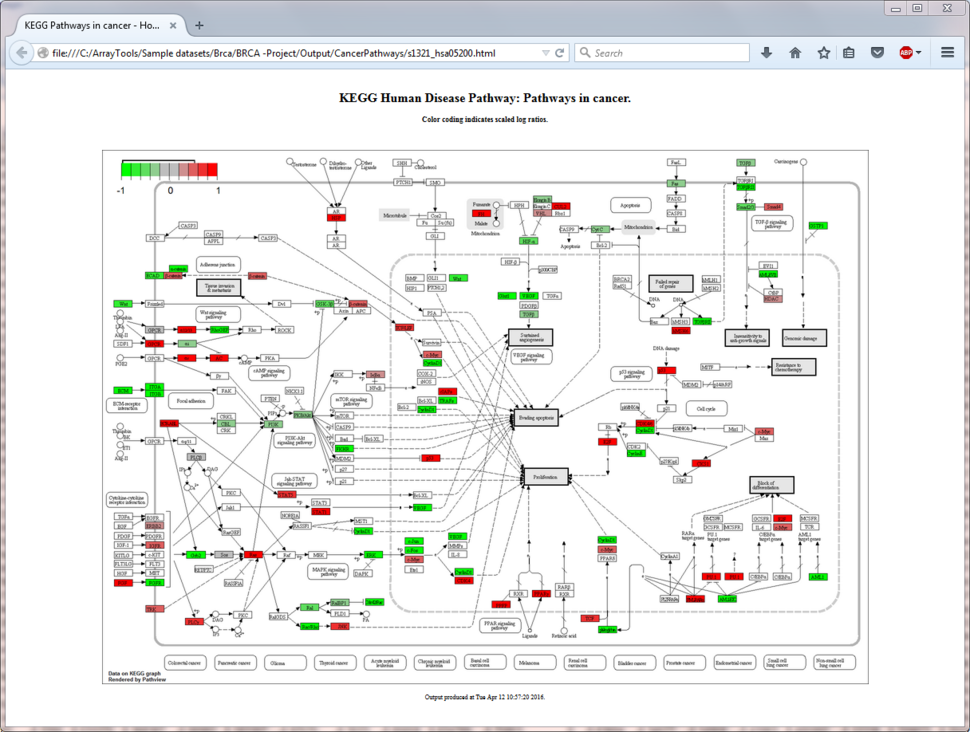
- KEGG Pathway Graphic Tool
- The Gene color coding for KEGG human disease pathways utility tool displays a KEGG disease pathway graph with selected genes being color-coded by their expression values or fold changes.
Methylation Data
- Import and process Illumina methylation data
- Find frequently methylated region
- Create a heatmap with methylation data
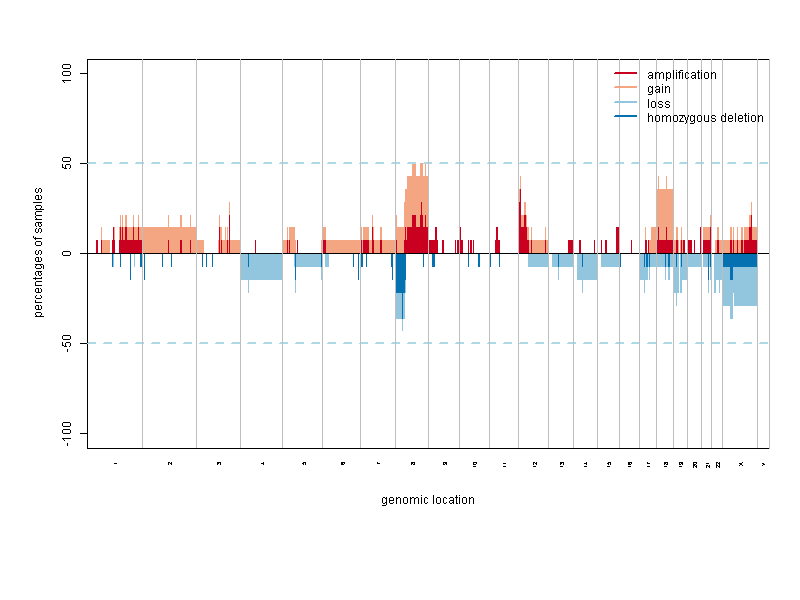
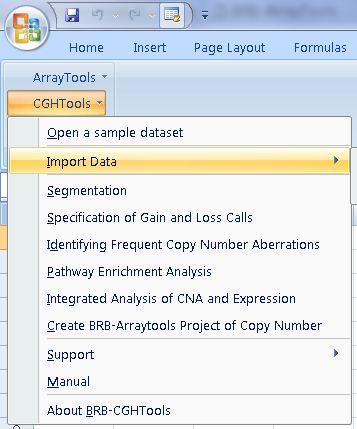
Copy Number Data
- Analyze copy number data in BRB CGHTools
- Specification of Gain and Loss Calls analysis